Dashboard
The Dashboard page provides users with a centralized overview of support requests and services within the SHI One platform. The main section displays a summary of active and completed support requests, including their current status and last update date. Users can view details for each request and create new ones as needed.
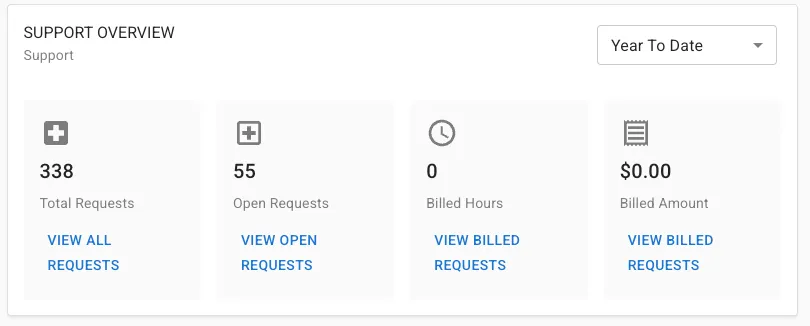
Key metrics are displayed including total requests, open requests, billed hours, and billed amounts. Visual charts illustrate the number of requests completed over time and the percentage of requests meeting Service Level Agreements (SLA). Additional metrics and filtering options are available to help users track performance and manage support activities efficiently. This page is designed to provide quick insights and streamline support management for users.
Getting Here
This module is viewable by all users, but the ability to view and submit requests will depend on the contracted services you have with SHI. By default users will see their own requests but the ability to see requests from other users may require specific authorized access by your admin.
You may also access this page through the navigation list on the left side of the screen by clicking Support for the Support Dashboard and Services for the Services Dashboard.
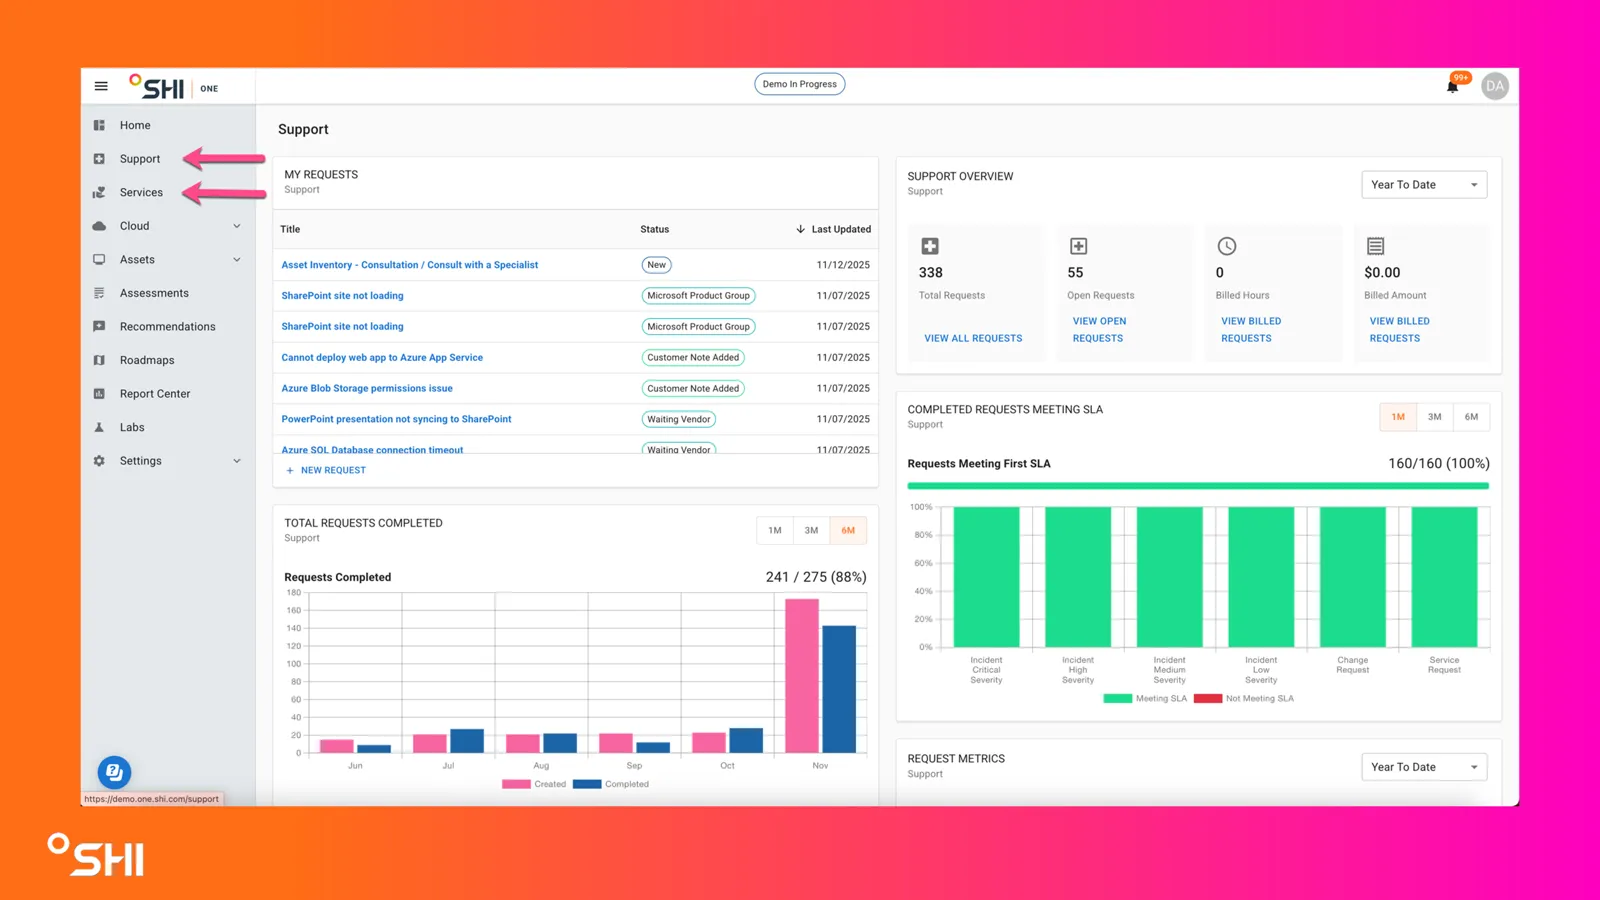
Using the Dashboard, you will be presented with a variety of widgets to assist you in monitoring your services & support and providing you with a comprehensive snapshot of what is happening.
Dashboard Widgets
Support Dashboard
Widget | Screenshot |
|---|---|
My RequestsLocated in the center of the page, this widget lists your recent or active support requests. It shows the title, current status (e.g., New, Waiting Vendor, Customer Note Added), and the date each request was last updated. You can also create a new request from this section. | 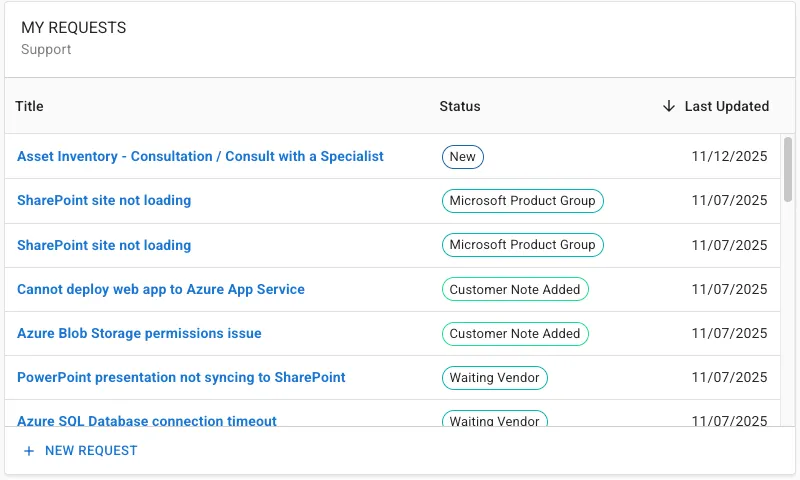 |
Support OverviewThis summary widget displays key support metrics:
|  |
Total Requests CompletedThis chart visualizes the number of support requests created vs. completed across your organization over the past months. It helps track support activity trends and completion rates. | 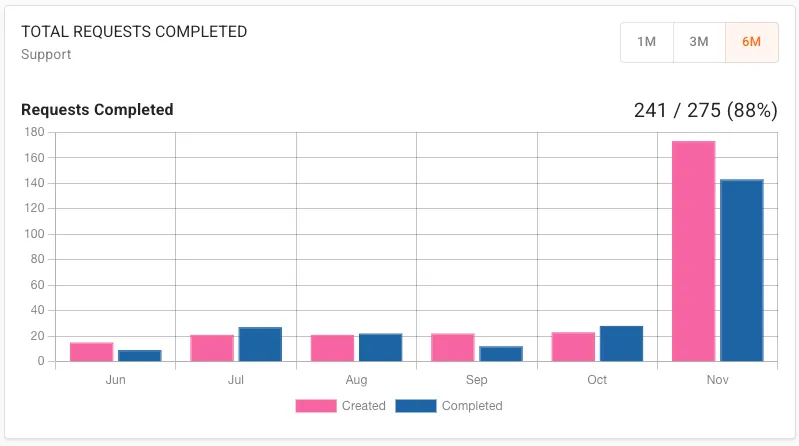 |
Request MetricsThis widget showcases three key metrics related to support performance. Average Rating is the average of the 1 to 5 star reviews that we've received. Every support ticket introduces an opportunity for a review. Also included is the First Response met SLA and any specific requests were the First Response was not met. | 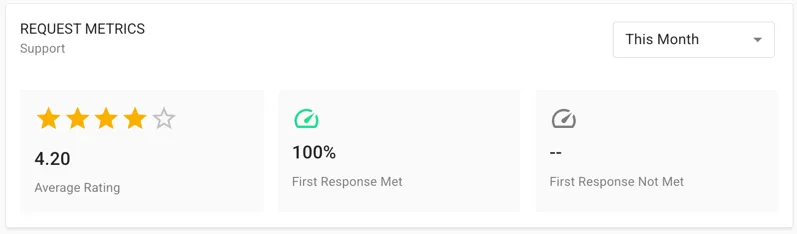 |
Completed Requests Meeting SLAThis bar chart shows the percentage of completed requests that met their Service Level Agreement (SLA) targets. It breaks down performance by request type or severity, with green indicating requests that met SLA and red for those that did not. | 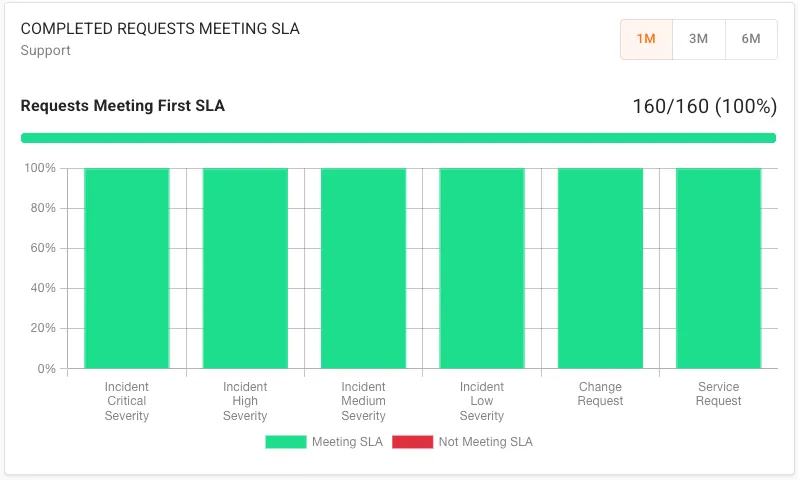 |