Microsoft Insights
[This article has recently been published and is subject to change.]
Overview
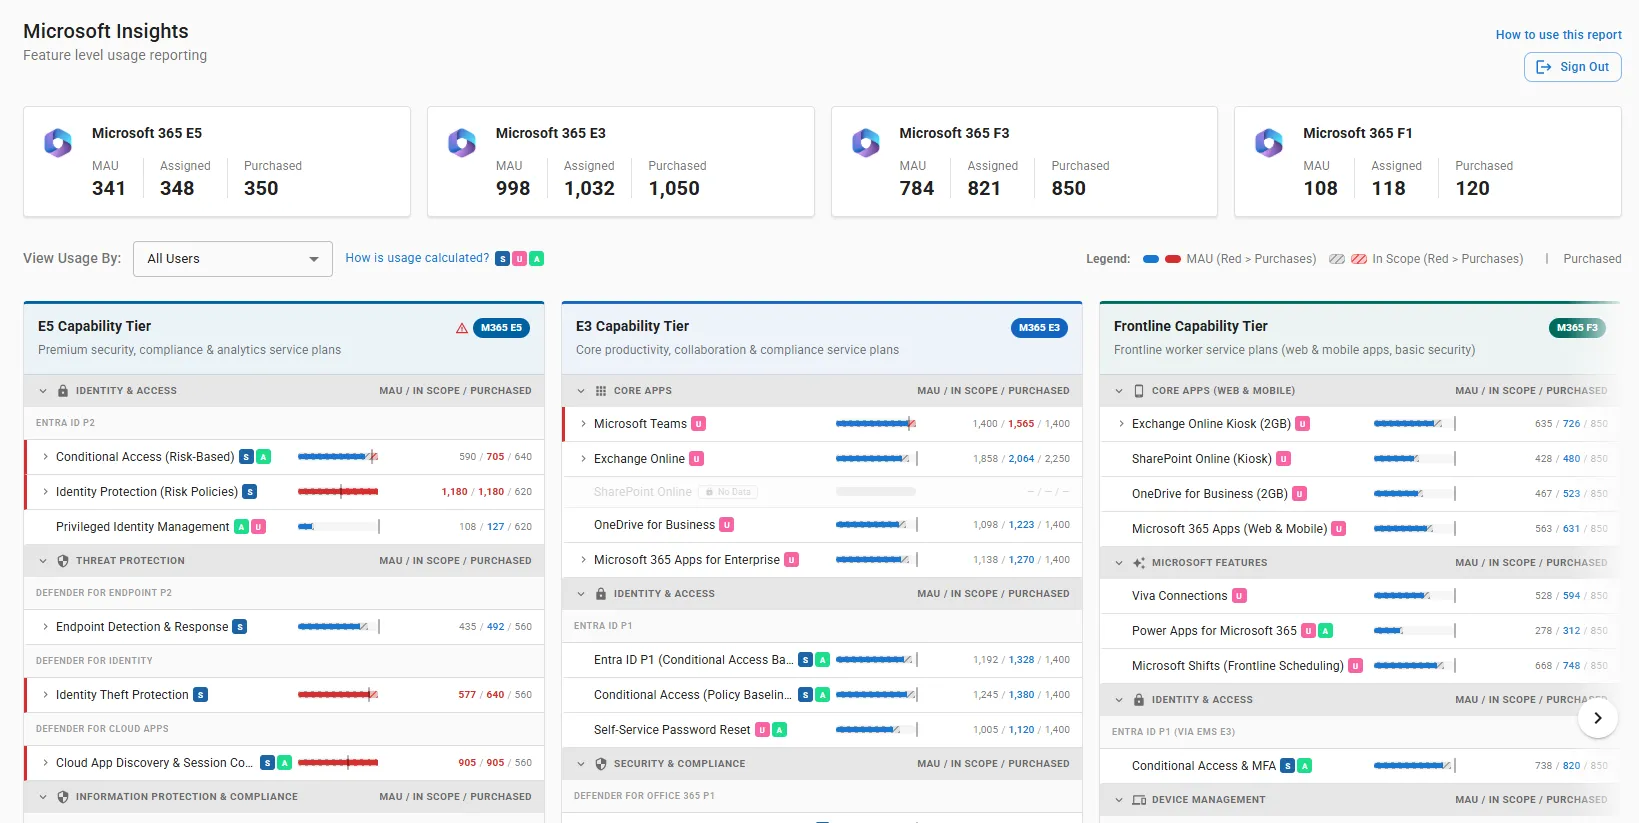
The data found in this report is populated from SHIELD. Data will not be available unless you have deployed SHIELD into your environment. For instructions on how to install SHIELD, see How to Install SHIELD. For more information about SHIELD, see SHI Environment Lockdown and Defense (SHIELD).
The integration between SHI One and Microsoft gives you incredible visibility into your tenant. The platform displays numerous metrics and advanced insights, all in one place. The insights tell you what users are actively using, what is being consumed, and what service plans are enabled in your environment. To put it simply, this report is designed to guide you in answering:
- What do I own?
- What are users consuming?
- What do I do with this information
Benefits
- Complete Visibility and Control - Gain a comprehensive view of which features are being used by users, administrators and systems. Instantly identify what licenses and capabilities your organization owns and see exactly how they are being consumed.
- Proactive Compliance and Risk management - Easily spot discrepancies between assigned, consumed, and purchased licenses. Microsoft Insights helps you quickly detect over-consumption, reducing compliance and financial risks by revealing when usage exceeds entitlements.
- Actionable Usage Intelligence - Track user assignments, monitor feature adoption, and unlock detailed consumption patterns. This gives you the ability to optimize license allocation, address gaps, and make informed decisions to maximize your Microsoft investment.
Sign In
- Go to SHI One: https://one.shi.com/
- Sign into SHI One using one of the available options and complete the login. We recommend signing in with Microsoft.
- Once you are signed in, click Assessments in the left navigation.
- Click Microsoft Insights.
Feature Level Usage Reporting
Top Level Metrics

The featured metrics at the top display common subscriptions along with the monthly active users (MAU), assigned licenses, and purchase licenses. The metrics at the top display immediate insights into the most common Microsoft service plans. By comparing the number of monthly active users and assigned licenses to the number of purchased licenses, you can easily see if your organization is compliant or not.
- Subscription Type - The specific Microsoft subscription plan that is being used (e.g., Microsoft 365 E3).
- Monthly Active Users (MAU) - Users who actively use the service within the monthly period.
- Assigned - The number of licenses that have been assigned to an endpoint. Endpoints are physical devices such as desktop computers, virtual machines, mobile phones, embedded devices, and servers that connect and exchange information with a computer network.
- Purchased - The number of licenses that have been purchased by your organization, typically through an agreement.
Example
In the example above, Microsoft 365 E5 has 341 monthly active users, is assigned to 348 endpoints, and there are 350 licenses purchased. In this situation, the organization is in good standing because there are 350 purchased licenses, while only 348 have been assigned. It's also important to note that of the 348 assigned licenses, only 341 have been used during the reporting period, which means there are 7 licenses underutilized.
Individual Usage Reports
Filters
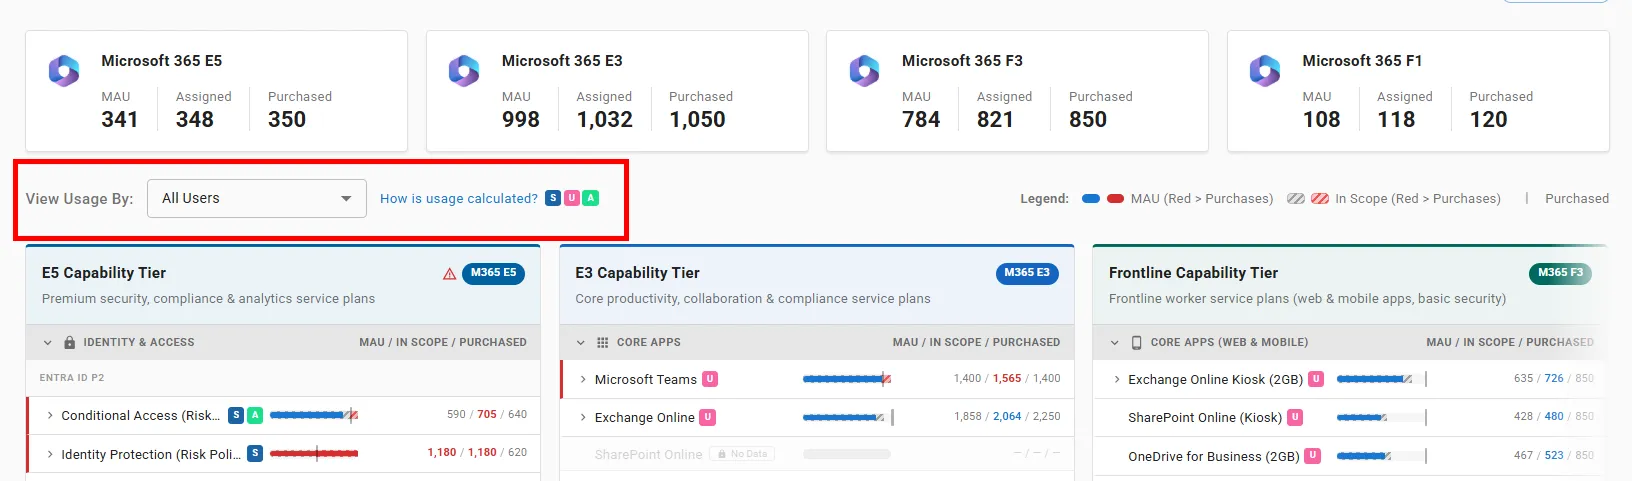
The filters at the top of the individual reports allow you to filter users by license. By default, the report will be filtered to All Users, but you can click on the drop-down menu and select any service plan that appears, even Unassigned users. Filters can help you quickly answer questions like:
- Are users with E3 licenses using E5 capabilities?
- Are users with E3 licenses in scope for E3 features?
Columns
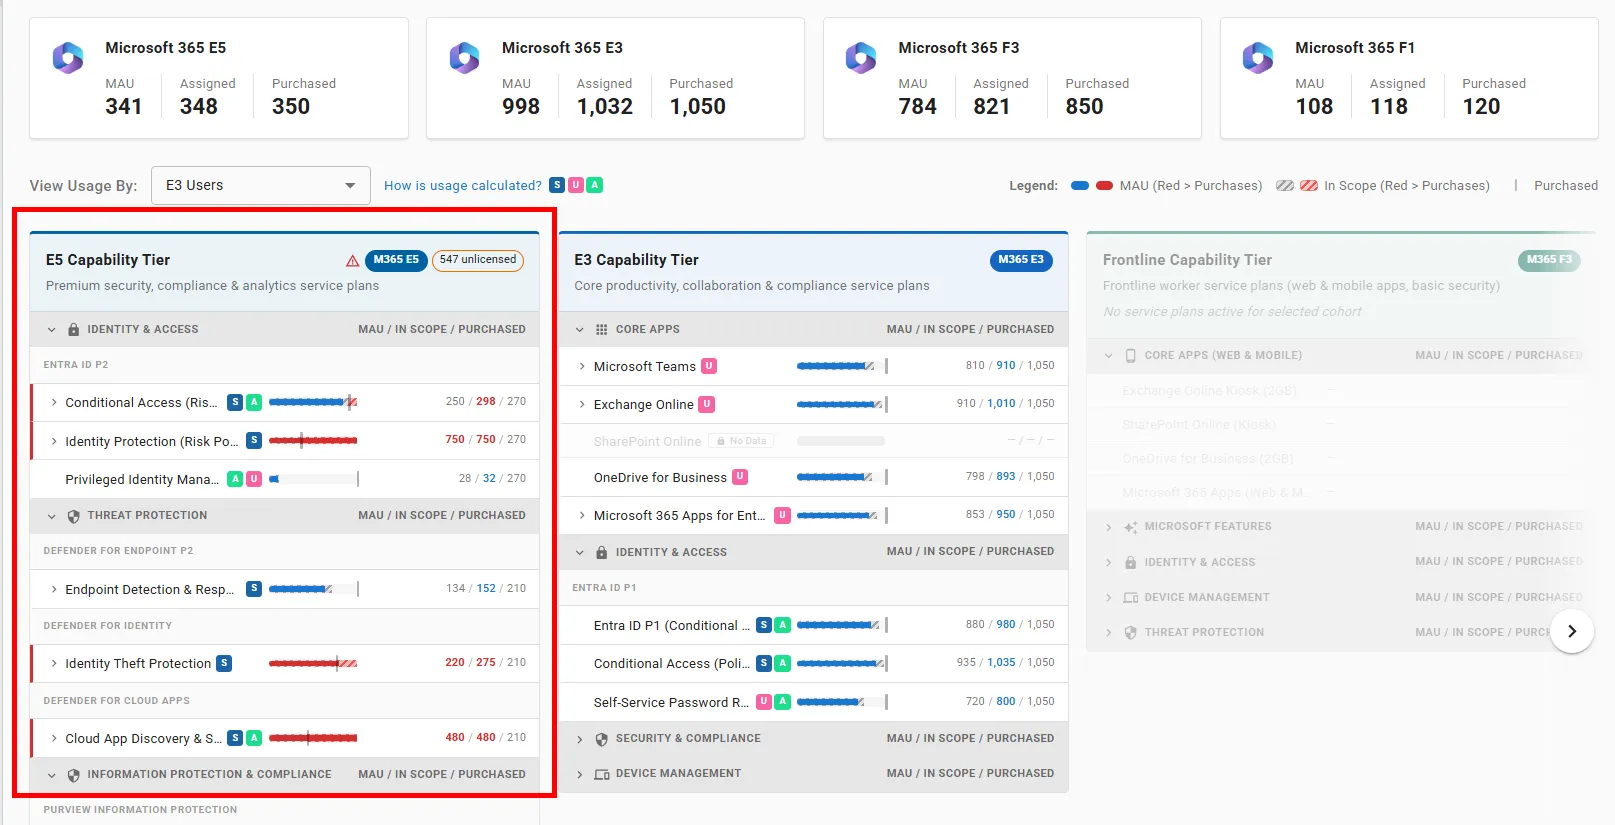
The reports section breaks down each capability tier into a single column. Each column has its own set of feature groups, along with the associated features. Some examples include:
- Identity & Access - Conditional Access (Risk-Based), Identity Protection (Risk Policies), Privileged Identity Management
- Threat Protection - Endpoint Detection & Response, Identity Theft Protection, Cloud App Discovery & Session Control
- Core Apps - Microsoft Teams, Exchange Online, OneDrive for Business, Microsoft 365 Apps for Enterprise
- Security & Compliance - Safe Links / Attachments / Anti-phishing, Sensitivity Labels (Manual)
- Device Management - Device Compliance, Device Management & Configuration Profiles, App Protection Policies
Feature Numbers
Next to each feature you will see summary of the feature in your environment. The structure is MAU / In Scope / Purchased.
- MAU (Monthly Active Users) - Users who actively use the service within the monthly period.
- In Scope - Users who have the service plan enabled in their license profile.
- Purchased - The number of licenses that have been purchased by your organization.
To understand this information, consider the following two examples:
Example 1: Endpoint Detection & Response Feature Usage

- Purchased Licenses: The organization owns 210 licenses for the Endpoint Detection & Response feature.
- Endpoints Enabled: This feature has been enabled on 152 devices or endpoints.
- Monthly Active Users: There are 134 people actively using the feature each month.
In this example, the organization is not overconsuming the Endpoint Detection & Response feature, since active usage (134) and enabled endpoints (152) are both below the number of purchased licenses (210). However, this organization may have more licenses than needed. Ideally, the number of purchased licenses should closely match the number of endpoints enabled and users actively using the feature. It's also important to note that having too many unused licenses may lead to unnecessary costs.
Example 2: Identity Theft Protection Feature Usage

- Purchased Licenses: The organization owns 210 licenses for the Identity Theft Protection feature.
- Endpoints Enabled: The feature has been enabled on 275 devices or endpoints.
- Monthly Active Users: There are 220 people actively using the feature each month.
In this example, the organization is overconsuming the Identity Theft Protection feature, since active usage (220) and enabled endpoints (275) are both greater than the number of purchased licenses (210). In other words, this organization is using more licenses than it has purchased and may face issues down the road.
Warnings
A warning appears when you have more users using a feature than the number of licenses you have purchased. In these situations, we recommend reaching out to your SHI representative, who will be able to assist you.
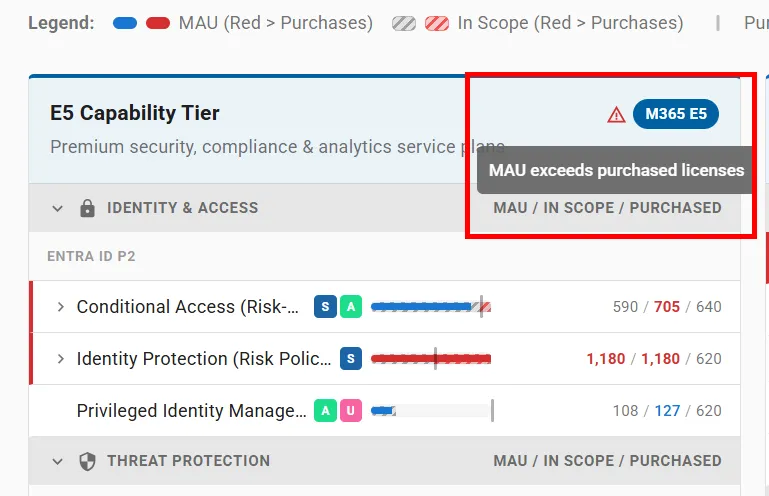
Sometimes, you might notice that the number of monthly active users is higher than the number of users "in scope." This is not an error; it's simply a result of how Microsoft calculates and reports these metrics.
License Types
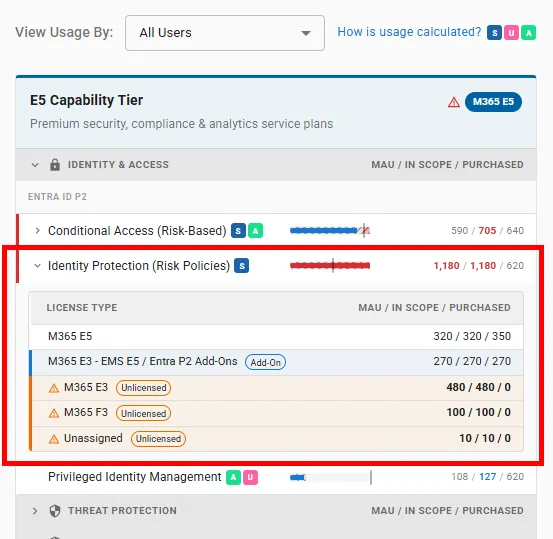
You can drill further into each feature to see the associated license type by clicking on the feature. This section shows you what license type is consuming the feature.
Example
In the above screenshot, we are viewing usage for All Users, and want to take a closer look at the Identity Protection (Risk Policies) feature, since the bar is red. When we click on the feature, we can see it is associated with the following license types in the environment:
- M365 E5
- M365 E3 - EMS E5 / Entra P2 Add-ons
- M365 E3
- M365 F3
- Unassigned
For the first two license types (M365 E5 & M365 E3 - EMS E5 / Entra P2 Add-ons), feature usage is less than or equal to the number of licenses purchased. In this case we can see the following breakdown:
- M365 E5 - 320 in scope - 350 purchased ✅
- M365 E3 - EMS E5 / Entra P2 Add-ons - 270 in scope - 270 purchased ✅
However, for the other three license types (M365 E3, M365 F3, Unassigned), feature usage is greater than the number of licenses purchased. In this case, we can see the following breakdown:
- M365 E3 - 480 in scope - 0 purchased ❌
- M365 F3 - 100 in scope - 0 purchased ❌
- Unassigned - 10 in scope - 0 purchased ❌
In total, the feature is being used on 1,180 devices, but the organization has only purchased 620 licenses. To resolve this, there are two options:
- Purchase more licenses to cover all usage
- Reduce the number of devices using the feature to match the number of licenses owned
Not every feature displays the associated license type. However, you will still be able to see monthly active users (MAU), the number of endpoints with the feature enabled (In scope), the number of licenses owned (Purchased).
Activity
Microsoft Insights considers a feature in use when a qualifying activity is detected within the selected reporting period. Activity is categorized into one of three usage types; System, User, and Admin:
- System (S) - Automatically generated by Microsoft.
- Examples: Policy Checks, Compliance, Security Monitoring, etc.
- User (U) - Activity created by users interacting with Microsoft features.
- Examples: Sending emails, joining meetings, opening files, applying sensitivity labels, etc.
- Admin (A) - Activity performed by administrators managing or reviewing Microsoft features.
- Examples: Role activations, audit searches, policy changes, investigations, etc.
Every feature will have an associated activity. Some features only have one activity, while others may have more than one.
A feature is considered "active" even if its activity is background or administrative in nature, if qualifying telemetry exists during the reporting period. Some products are measured primarily through user-driven actions. Others reflect value through system-driven and admin-driven activity. Some examples include:
- User Driven
- Teams
- Exchange
- SharePoint
- System & Admin
- Defender for Identity
- Conditional Access
- Intune
- Data Loss Prevention (DLP)
Data Unavailable
The first phase of Microsoft Insights is pulling in data. If you have successfully installed SHIELD, you should see data for the following sections:
- Entra ID P1
- Entra ID P2
- Defender for Identity
If data is not available in the platform or certain columns are grayed out, it is likely due to one of the following reasons:
- SHIELD Not Installed
- If SHIELD is not installed in your environment, the system will not be able to display any insights in the report. For steps to install SHIELD, see How to Install SHIELD. If you need help, email [email protected].
- Permissions Not Granted
- The Microsoft Graph Reports API requires the Reports.Read.All permission to be granted for the workload. To resolve this issue, make sure the required API permissions have been consented to the Entra ID or reach out to the user who oversees granting permissions.
- API Access Not Available or Enabled
- This may be because the API has not been turned on yet or does not exist (such as a non-public API access).
- Organization Does Not Have Service Plan or License
- If a service plan or license is not active for the relevant Microsoft products, the system cannot retrieve or display usage information in the report. In this situation, you should check to confirm your organization's current service plans and licenses.
Glossary
- Monthly Active Users (MAU) - Users who actively used or benefited from the service during this period.
- Return on Investment (ROI) - A performance metric used to evaluate an investment.
- In Scope - Users who have the service plan enabled in their license profile.
- Assigned - The number of licenses that are assigned to an endpoint.
- Purchased - The number of licenses owned by your organization.
- In Use - Qualifying activities are detected within the selected reporting period.
- System-Driven - Automatically generated by Microsoft.
- User-Driven - Activity created by users interacting with Microsoft features.
- Admin-Driven - Activity performed by administrators managing or reviewing Microsoft features.
- Service Plans - Bundles of features and capabilities grouped together under a single license or subscription. Service plans define what functionalities are available to users in the organization.
- Feature Sets - Collections of related features that work together to deliver specific functionality or address a particular business need. Feature sets typically focus on a core area, such as security, collaboration, or device management.
- Consumption - The actual usage of features or services by users, devices, or systems in an environment. It measures how much of the licensed capabilities are being actively used.
- Capability Tiers - Different levels or categories of features, often organized by complexity or value. Higher tiers generally include all features from lower tiers, plus additional advanced capabilities.